CFD Analysis of Pollutant Dispersion in Kitchens
By Kishor Khankari, PhD, ASHRAE Fellow
Proper ventilation in the kitchen in a multi-family housing unit is crucial for reducing exposure to pollutants generated during cooking and from gas stove burners. Mechanical kitchen ventilation with range hoods or over-the-range microwaves (OTR) can potentially reduce the occupant exposure to cooking-related indoor pollutants.
Several factors related to the exhaust hoods and user behavior can affect the ventilation performance. The flow rate and physical characteristics of the exhaust fan used during cooking were the most important determinants of integrated exposures following cooking.1
However, the actual usage of the kitchen ventilation during cooking is low. Occupants often do not use their range hood due to the lack of awareness of the benefits of kitchen ventilation. A large survey of Canadian homes showed that only 30% of households reported regularly using their range hood2. The inadequate use of ventilation during cooking highlights the need for educational programs on cooking exposures and ventilation strategies.
A field study of nine homes in California showed wide variations in pollutant concentrations both across and within homes3. Four of the nine homes had kitchen levels that exceeded the national ambient air quality standard threshold of 100 ppb NO2 over 1h4. Field measurements of exhaust flow rates have shown a wide range.
For example, one study found rates ranging from 76 to 309 cfm (36 to 146 L/s), with actual flow rates 12–31 percent lower than those specified in product literature.1 Another study found airflow rates varying from 92 to 275 cfm (43 to 130 L/s) for different over-the-range microwaves (OTR) and range hoods5. ASHRAE 62.2 requires range hoods to move at least 100 cfm (47 L/s) of airflow with a downstream duct static pressure of 62.5 Pa6.
In addition to the exhaust flow rates, the airflow patterns in the kitchen play a key role in determining the flow path of pollutants and its distribution in the space. Therefore, understanding these airflow patterns and flow paths is crucial for determining the level of pollutant exposure for people in the space.
The dispersion of pollutants and their flow paths can be influenced by a variety of interconnected factors. These factors include exhaust flow rates, the design of the exhaust hood, size and location of make-up air openings, the location and capacity of the cooking burners, cooking practices, and user behavior when operating the kitchen ventilation system.
Conducting physical tests on all these factors under controlled conditions for various operating conditions can be time-consuming and labor-intensive, if not impossible. Computational Fluid Dynamics (CFD) analysis offers a practical alternative for systematically evaluating all these parameters.
What is Computational Fluid Dynamics (CFD)?
CFD is a science that deals with simulation and analysis of fluid flow, heat transfer, mass transfer, and other similar transport processes. CFD analyses are based on laws of Physics such as the conservation of mass, momentum, and energy.
The science employs numerical methods to solve the underlying transport equations. It thus predicts temporal and spatial variations of governing entities such as velocity, pressure, temperature, chemical concentrations, etc., without requiring the assumption of well-mixed conditions. CFD simulations yield a wealth of information related to time-varying three-dimensional distributions of these entities that are difficult to obtain through prototyping or physical testing.
There are numerous examples of CFD use for various applications that aim to meet specific design goals. For example, designing smoke exhaust systems for fire scenarios, predicting the transient time-temperature history of chilled water in thermal storage tanks, analyzing stratified ventilation systems such as traditional displacement ventilation (TDV) and underfloor air distribution (UFAD), as well as optimizing the cooling performance of data centers, cleanrooms, and laboratory ventilation systems. Additionally, these tools can be used for predicting plume dispersion from exhaust stacks and equipment yards of large data centers, among other applications.
This study utilizes CFD simulations to examine the effectiveness of residential kitchen ventilation for various exhaust flow rates. It assesses the transient dispersion of nitrogen dioxide (NO2) and temperature distribution using an identical setup and release rate of NO2. The study also introduces two new measures, Spread Index (SI)TC and Purge Time (PT)TC, to evaluate the effectiveness of kitchen ventilation. The main goal of this CFD study is to demonstrate relative spread of pollutants in the kitchen due to the indoor airflow patterns.
Description of the CFD model
A three-dimensional, transient, non-isothermal CFD model of a kitchen and the adjacent living room in a multi-family housing unit was developed for this study. The total floor area of the model space is 375 sq. ft. (35 m2) (15 x 25 feet, 4.6 x 7.6 m) with a 9-foot (2.7 m) ceiling height. The kitchen floor area is 143 sq. ft. (13 m2) (11 x 13 feet, 3.3 x 4 m).
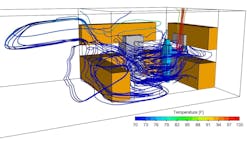
As shown in Figure 1, the kitchen has cabinets, a nook, a refrigerator, and an occupant standing in front of the cooking range. The door between the living room and the kitchen is assumed to be open. Additionally, a large nook opening (9.75 x 4 feet, 3 x 1.2 m) is placed between the kitchen and the living room. The kitchen is equipped with an over-the-range microwave with an integrated exhaust fan. The exhaust air is vented outdoors through two exhaust grilles placed under the microwave. The outside air is supplied through a door undercut of the main door in the living room.
This model setup represents typical operating conditions of a kitchen during the winter season in a cold climate region with closed doors and windows. In such situations, the leakages through door undercut remain the major source for the makeup air.
The transient (time varying) analysis was performed for a total duration of 30 minutes with exhaust flow rates of 75, 150, and 300 cfm (35, 70, and 140 L/s). The flow rates correspond to the air change rates of 1.3, 2.6, and 5.2 1/h, respectively, for the entire space. Whereas for the kitchen space, these flow rates correspond to the air change rates of 3.5, 7, and 14 1/h, respectively.
The front burner located on the right side of the cooktop is assumed to be 'ON' for the first 15 minutes. The heat release rate from the burner is assumed to be 17000 Btu/h (5 kW), of which 80 percent is to be consumed by the cooking process. The rest is dissipated to the surrounding area.
Nitrogen Dioxide (NO2) was considered as the main contaminant generated from the gas burner during the natural gas combustion process. A constant generation rate of NO2 was assumed to be 3.307E-06 lb/min (1.5E06 ng/min).4 The NO2 generation rate was assumed to be constant and the same for all analyses. The ambient concentration of NO2 is assumed to be zero. The previous study showed significantly lower levels of ambient NO2 concentrations relative to those generated from the indoor emissions.
A virtual sensor was placed in the model in front of the occupant’s face, as well as in the two exhaust grilles to monitor time-varying concentrations at each location. With the help of this data, the exposure (dose) for the occupant was computed by the cumulative product of the NO2 concentration (ppb) and the duration of the exposure (min). The standard k-e turbulence model was employed to compute the turbulent viscosity of the air. A computational mesh of 1.2 million hexahedral mesh was created by placing fine mesh near the strategic locations.
Spread Index (SI) TC : is a CFD-based metric developed to analyze and quantify the spread of pollutants in a given space. It is computed as the ratio of the volume occupied by the pollutant level above a certain acceptable concentration (TC) to the total volume of the space. The goal of the kitchen ventilation systems is to minimize the contaminant concentrations below acceptable concentration throughout the space and to limit the spread of pollutants. Spread Index (SI)TC is a metric of ventilation effectiveness that helps quantify the spread of pollutants in a three-dimensional space.
In an ideal scenario, the concentration levels should always remain below the acceptable target value, indicating a (SI)TC close to zero during and after cooking. It's important to note that the safe concentration levels depend on various risk factors, such as the type and quantity of pollutants released during the cooking process. Higher (SI)TC values can indicate the spread and accumulation of pollutants above acceptable concentration levels.
The design of a ventilation system as well as the resulting airflow patterns and pollutant flow path play a crucial role in determining the (SI)TC levels in the space7. For the demonstration purposes, the target concentration of NO2 was assumed to be 100 ppb, which is an EPA-acceptable concentration level for 1h. This is an acute limit for short term exposure.
Purge Time (PT)TC: It is the amount of time required for a kitchen ventilation system to reduce the Spread Index (SI)TC from its highest value to zero. Essentially (PT)TC measures how well the ventilation system in clears the space and reduces the pollutant concentration to a safe level (target concentration). (PT)TC can provide valuable guidance in estimating the decay rate of pollutants after the burners are turned off.
In this study, the impact of exhaust flow rates was analyzed by evaluating the (PT)100ppb values.
Results and Discussion
Airflow Patterns
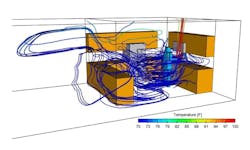
Figure 2 shows the airflow patterns in the kitchen for the make-up air entering into the kitchen through an open door between the kitchen and the adjacent space. The airflow path lines are colored by the air temperature. As shown in this figure, the make-up air is drawn towards the exhaust grilles located under the microwave oven. The hot air that is released around the burner rises upward towards the ceiling in front of the person. It also shows the air from the kitchen escapes into the adjacent living room.
As mentioned before, the make-up air enters the space through the gap under the main door in the living room (not shown in the Figure 2). Three-dimensional airflow patterns in the entire space are quite complex and have a large impact on the spread and distribution of pollutants in the space.
Temperature Distribution
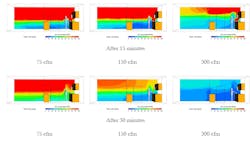
Figure 3 shows temperature distribution on a vertical plane passing through the burner and the person after 15 and 30 minutes for the three exhaust airflow rates. These figures indicate thermal stratification in the space for all flow rates during the first 15 minutes when the burner is 'ON' and even after the burner is 'OFF'.
The hot air rises towards the ceiling and then moves along the ceiling into the adjacent space. In the cases of 75 and 150 cfm exhaust flow rates, the temperature distribution in the kitchen space shows a little difference.
However, in the case of 300 cfm exhaust flow rate, the hot air is drawn into the exhaust grilles during the first 15 minutes and the purge of hot air is complete at the end of 30 minutes. Note a thermal plume rising from the person is visible in the figure for the temperature distribution at the end of 30 minutes for a 300 cfm exhaust.
Distribution of NO2 Concentration
Figure 4 illustrates the distribution of NO2 concentration on a vertical plane passing through the burner and the person at 15 and 30 minutes for all three exhaust airflow rates. These figures show that there is a higher concentration of NO2 in the upper section of the kitchen, which can be due to thermal stratification. Similar to the temperature distribution, there is little difference in the NO2 concentration in the space for the 75 and 150 cfm exhaust flow rates.
However, during the purge phase after the burner is turned off (at 30 minutes), the thermal plume plays a crucial role in maintaining low concentration levels in front of the person. The displacement of hot air can draw the surrounding clean air around a person.
For the same reasons, in the case of a 300 cfm exhaust flow rate during the first 15 minutes, concentration levels of NO2 in front of the person are at their lowest, and by the end of the purge phase (30 minutes), the concentration levels are further reduced.
Spread Index (SI)100ppb and Purge Time (PT)100ppb
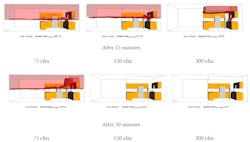
Figure 5 shows the Spread Index (SI)100ppb plots for all three exhaust flow rates at the end of 15 and 30 minutes.
The Spread Index plots show the areas with NO2 concentration levels at or above 100 ppb. As depicted in the figure, at the end of 15 minutes, increasing the exhaust flow rate from 75 to 300 cfm resulted in a significant reduction in the Spread Index from 60.1 to 10.8 percent, which is about an 82 percent reduction.
On the other hand, increasing the flow rate from 75 to 150 cfm only led to a 14.8 percent reduction. At the end of 30-minute, with a 75 cfm exhaust flow rate, the (SI)100ppb reduced by only 19 percent. However, in the cases of 150 and 300 cfm, the (SI)100ppb reduced to zero, indicating that the entire space had NO2 concentration levels lower than 100 ppb.
The exhaust flow rate of 300 cfm keeps the contaminated air with NO2 confined to the kitchen and prevents it from spreading into the adjacent living room. It's interesting to see a dark cloud forming over the person's head, indicating a pocket of low NO2 concentration (less than 100 ppb) due to the thermal plume. This plume can act as a "protective shield," displacing pollutants away from the person and reducing their exposure levels.
Thermal stratification causes pollutants to accumulate and move along the ceiling, above the breathing zone of occupants. It suggests that running a bathroom exhaust fan near the kitchen could help remove the contaminated air near the ceiling, although this was not explored in this study.
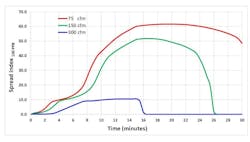
Figure 6 shows the variation of the Spread Index (SI)100ppb with time for all three exhaust flow rates. As shown in this figure in the case of 75 cfm exhaust flow rate, the (SI)100ppb never reaches zero value which indicates that the 75 cfm exhaust flow rate is inadequate to purge NO2 level below the acceptable value. Whereas in the cases of 150 and 300 cfm exhaust flow rates, the Purge Time (PT)100ppb is 26 and 16 minutes, respectively. These values indicate the time required to lower the NO2 concentration level below 100 ppb.
In all the cases, the (SI)100ppb reaches peak values at 15 minutes, at which time the burner is turned off and the generation of NO2 stops. Thereafter, with increasing air change rates, the rate of decay also increases. This figure shows the impact of both the dilution due to increased airflow rate and the rate of removal due to increased ACH. Increasing the exhaust airflow rate from 75 to 150 cfm shows a significant impact on the purge rate and Purge Time (PT)100ppb.
It should be noted that for a 300 cfm exhaust flow rate due to high air change rates, the (SI)100ppb reaches its peak sooner and remains at a steady level for 7 minutes.
Analysis of Exposure (Dose)
Figure 7 shows variations of NO2 concentration in front of the person’s face as detected by the virtual sensor and the associated cumulative exposure with time. As shown in this figure the NO2 concentration levels for all three flow rates (except for the 75 cfm) remain below 100 ppb, resulting in significantly lower exposure level than the EPA-acceptable limit of 100 ppb-hr.
The peak cumulative exposure value is 30 ppb-hr for the case of 75 cfm exhaust flow rate for 30 minutes. This is consistent with the previous studies indicating that even moderately effective venting range hoods dramatically reduce the pollutant concentration levels.8
It should be noted that during the first 15 minutes when the burner is 'ON', the cumulative exposure levels remain below 10 ppb-hr. Further, the cumulative exposure increases during the purge phase when the burner is 'OFF' (no NO2 generation). Such exposure can be realized only when the occupants stay near the stove even after the cooking is over, which can happen on rare occasions.
It is important to note that such low exposure can be attributed to the thermal stratification in the space which displaces the contaminated air above the breathing zone.
Summary and Conclusions
In this CFD study, the impact of exhaust flow rate on the dispersion of NO2 in a residential kitchen was evaluated. A three-dimensional, transient, non-isothermal CFD model was developed to study the transient temperature distribution and the dispersion of NO2 in the kitchen and the adjacent living room. The effectiveness of the kitchen ventilation was evaluated using newly developed metrics of Spread Index (SI)100ppb and Purge Time (PT)100ppb.
The study analyzed the conditions with closed windows and doors which is common during the winter in the cold climate. It was found that an exhaust flow rate of 75 cfm is inadequate for effectively removing pollutants from a kitchen space.
Increasing the exhaust flow rate was shown to reduce the spread of high-concentration zones of pollutants into adjacent spaces, as indicated by the Spread Index analysis. Additionally, increasing the exhaust flow rate reduces the Purge Time (PT)100ppb and helps in the effective removal of residual pollutants after cooking when the burner is turned 'OFF'.
The analyses also suggest that the thermal plume from occupants and the buoyancy of hot gases can help reduce the cumulative NO2 exposure. While occupant NO2 exposure levels remained significantly low during the first few minutes of cooking when the burner is 'ON', the exposure level starts increasing during the purge phase when the burner is turned 'OFF'.
However, an increase in the exhaust flow rate significantly reduces cumulative NO2 exposure levels. It is important to note that for all exhaust flow rates analyzed in the study, the cumulative NO2 exposure levels remained significantly below the EPA-acceptable level of 100 ppb-hr for short-term exposure. The analyses also indicate that thermal stratification causes pollutants to accumulate and migrate along the ceiling above the breathing zone of occupants.
Furthermore, the thermal plume from an occupant can form a "protective shield" to help reduce pollutant exposure. This study suggests that CFD can be a valuable tool in analyzing these parameters cost-effectively and optimizing the performance of kitchen ventilation systems.
References
1. Nina A. Dobbin, Sun L., Wallace L., Kulka R., You H., Shin T., Aubin D., St-Jean M., Singer B.C. 2018 The benefit of kitchen exhaust fan use after cooking - An experimental assessment. Building and Environment 135 (286–296).
2. Sun L., Singer B.C. Cooking methods and kitchen ventilation availability, usage, perceived performance and potential in Canadian homes. 2023 Journal of Expo Sci Environ Epidemiol 33, 439–447
3. Brett C. Singer, Delp W., Lorenzetti D.M. Maddalena R. L 2016. Pollutant Concentrations and Emission Rates from Scripted Natural Gas Cooking Burner Use in Nine Northern California Homes. Ernest Orlando Lawrence Berkeley National Laboratory Report.
4. US EPA (2016) Integrated Science Assessment for Oxides of Nitrogen - Health Criteria (2016 Final Report), Washington DC, U.S. Environmental Protection Agency.
5. Zhao, Haoran, Delp W., Chan W., Walker I., Singer B.C. 2020. Measured Performance of Over the Range Microwave Range Hoods. Lawrence Berkeley National Laboratory Report.
6. ANSI/ASHRAE. 2022. Ventilation and Indoor Air Quality in Residential Buildings, Standard 62.2-2022.
7. Khankari, Kishor. 2016. Analysis of Contaminant Flow Path and Laboratory Ventilation Effectiveness. ASHRAE Conference Paper for ASHRAE Annual Conference. St. Louis, MO.
##########
Based in Ann Arbor MI, the author is an ASHRAE Fellow and President of AnSight LLC, his own consulting engineering practice specializing in computational fluid design (CFD) for building HVAC and data centers. Contact: [email protected].
About the Author
KISHOR KHANKARI, PhD, AnSight LLC, Ann Arbor, Mich.
Dr. Kishor Khankari is president and founder of AnSight LLC. As a specialist in Computational Fluid Dynamics (CFD). he has several years of experience in providing consulting services that have resulted in optimized solutions to a wide variety of engineering problems. Kishor has a Ph.D. in CFD from the University of Minnesota and has regularly published in several technical journals. An ASHRAE Fellow and ASHRAE Distinguished Lecturer, he is a recipient of the ASHRAE Distinguished and Exceptional Service Award; past President of ASHRAE Detroit Chapter, past Chair of ASHRAE Research Administration Committee (RAC) and many other esteemed positions and service to the industry.
HPAC contributions
Aerodynamic Containment Can Reduce Indoor Spread of Infectious Aerosols | HPAC Engineering
Health-Care Patient-Room HVAC Airflow Patterns | HPAC Engineering
