In the past, most data-center cooling systems were designed based on rules of thumb or trial and error, and large margins of safety were used to compensate for the inaccuracies in those approaches. But the rapid increase in the power density of modern computing, networking, and storage equipment means that energy costs for power and cooling frequently are higher than the cost of the information-technology equipment they support, when amortized over a typical three-year period. It has become critical to analyze data-center design to optimize the local airflow and heat-transfer conditions that play such an important role in cooling-system performance. Computational-fluid-dynamics (CFD) software tools provide the ability to simulate the performance of data centers and predict the effects of air handlers, power-dissipation sources, raised floors, and other features on temperatures throughout a data center. Following is a case of CFD being used to simulate a typical data center and evaluate the effect of design changes on cooling performance and energy costs.
EVALUATING DATA-CENTER COOLING
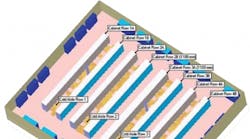
The simulations in this article are based on a real data center located in London. A base case was prepared to reflect the original design concept. The data center is 28-m long and 22-m wide and has a ceiling height of 3 m. Cooling is provided by 12 Denco computer-room-air-conditioner (CRAC) units, each of which has a cooling capacity of 92.5 kw and supplies air at a flow rate of 7.6 cu m per second. The supply set point was 14°C. The units were configured to discharge air downward into a 0.7-m floor void. No information was available on the specific distribution of heat sources, so a distributed load of 1,200 w per square meter was specified. All cabinets in the room were 0.6-m wide and 2-m high. The room was set up with four cold aisles, each of which was 1.8-m wide (Figure 1). There was a row of 25 cabinets on each side of each cold aisle. Two depths of cabinets were used — 1.1 m and 0.9 m — but were not mixed within a single row. Various heat loads from 500 w to 6 kw for each cabinet were applied.
The described base case was simulated along with six variants that were designed to assess the impact of changes in design and operating conditions on the data center. The base-case simulation shown in Figure 2 indicates that all of the cold aisles have a supply of cool air ranging from 14°C to 20°C. Warmer patches in the cold aisles match regions without active floor grilles. Warm air can be observed exiting the backs of the cabinets into the hot aisles. Cold air also can be observed moving from the ends of the cold aisles toward the CRACs, indicating the supply air exceeds the amount required by the cabinets. The total supply is approximately 140 percent of the cabinet requirement, based on a temperature rise of 10°C, indicating that the number of CRACs could be reduced to nine (although this would allow no redundancy).
IDENTIFYING THE ROOT CAUSE
One of the key benefits of computer simulation is its ability to help identify the cause of a problem. It can be used to understand why the cabinet located at the end of Row 1B was the only one to receive air above 20°C in the base case. In Figure 3, particle tracking is used to track the source of the air entering the front of the problem cabinet. The particles are colored to represent their temperatures. The simulation output shows how warm air from the backs of the cabinets reaches the front of the problem cabinet.
The first variant evaluated the effect on data-center cooling of eliminating one CRAC unit (Figure 4). This reduced the proportion of grilles operating within ±5 percent of the mean flow from 78 percent in the base case to 64 percent. The number of cabinets receiving air above 20°C increased from one to seven. This can be understood by observing pressure distribution in the void (Figure 5). With all of the 12 CRAC units operating, pressure distribution 0.2 m above the floor slab generally is uniform. With one CRAC out of operation, a greater pressure variation is seen, particularly near the failed unit.
EFFECT OF REDUCING FLOOR VOID
Figure 6 shows temperatures at the level of the equipment intake for the case in which the floor void is reduced to 0.5 m. The simulation output shows that the number of cabinets receiving air above 20°C has increased from one to five. Most of the cabinets receiving the hot air are toward the ends of rows, although one cabinet in the middle of Row 1B is receiving hot air. The amount of cool air leaking from the ends of the cold aisles also is reduced (Figure 7). The number of grilles with flow within ±5 percent of the mean has been reduced from 78 percent in the base case to 33 percent. The pressure distribution in the void shows an increase in nonuniformity.
Adding a cover over the cold aisle increased the uniformity of flow (Figure 8). With this change, 85 percent of the grilles are within ±5 percent of the mean flow. Temperature is reduced to the point that no cabinets receive air above 20°C.
ADDING A CEILING VOID
Figure 9 studies the addition of a ceiling void with grilles above the hot aisles for the purpose of removing the hot air and preventing it from being drawn into cabinets. The simulation showed that, for this particular configuration, this change had a detrimental effect. The variation of flow and temperature distribution within the aisles were similar to the base case, but a greater number of cabinets received higher-temperature air intake flow, including one that received air at 25.2°C. The hot cabinets were located at the ends of rows. The reason was readily apparent from the simulation results — the cold air moved up into the ceiling void, where it had no chance to be pulled into the cabinets.
A further simulation was set up to address the possibility of problems caused by a pipe running through the floor void. In this particular room, this change had only a minor impact, with the number of grilles within the 5-percent flow band being reduced to 73 percent and no change in the number of cabinets seeing elevated temperatures at their air intakes.
ACTIVATING ALL OF THE TILES
Activating all of the floor tiles in the cold aisles by setting their dampers fully open reduced the number of cabinets with an air-intake temperature in excess of 20°C from one to zero and reduced the proportion of cabinets with elevated temperatures. Additional simulations investigated the effect of adjusting the damper positions to balance and optimize the volume of cool air entering in each location. Dampers attached to grilles with higher flow rates were reduced to 75-percent open. This achieved more uniform flow rates through the grilles and reduced the number of cabinets suffering from elevated temperatures.
CONCLUSION
Rising power loads are making it more important than ever to optimize data-center cooling to ensure the reliability of computing equipment and reduce cooling costs. CFD simulation software addresses this need by evaluating the performance of alternative data-center designs quickly and inexpensively. In this example, the CFD simulation results showed that the cooling capacity was about 140 percent of that needed for the 1,200-w-per-square-meter load. However, detrimental effects were seen when a single cooling unit failed, primarily because of less-uniform air distribution in the floor void. Reducing the floor-void depth reduced performance for the same reason. Covering the cold aisle improved performance; however, using a ceiling extract system actually made things worse. Increasing the number of active floor grilles provided performance improvements, but for full benefit to be gained, the resistance between the floor void and the room had to be increased in some locations by adjusting dampers. Detailed CFD simulations enable well-informed design changes such as these to be made with complete confidence, thus, substantially improving the energy efficiency of data-center cooling while ensuring the availability of mission-critical resources.
For Design Solutions author guidelines, call Scott Arnold, executive editor, at 216-931-9980, or write to him at [email protected].


