Fan Selections and Their Energy Impacts, Part 2 of 2
Fans and fan systems can be significant consumers of energy in commercial applications and the greatest consumer in industrial ones. Concerned about underperformance, designers tend to compensate for uncertainties by adding capacity to fans. Oversizing fan systems creates problems that can increase costs and decrease reliability. This article explains how to evaluate fans and fan systems and their impact on operating costs. It does so by examining the criteria most commonly used in fan selection:
- Air-stream characteristics.
- Capacity.
- Pressure.
- Power.
- Efficiency.
- Fan and system curves.
Last month, in Part 1 of this article, we discussed air-stream characteristics, capacity, and pressure. This month, the article concludes with discussion of power, efficiency, and fan and system curves.
Power
There are three categories of fan horsepower:
- Chart horsepower.
- Operating horsepower.
- Air horsepower.
Chart horsepower. Often referred to as brake horsepower, chart horsepower (CHP) is the power required at a fan shaft to drive a fan. The only loss it may include is bearing drag. It always is stated at standard inlet-density conditions of 0.075 lb per cubic foot and, thus, should be corrected for non-standard inlet-air-stream densities. Corrections are calculated by multiplying the standard density, airflow, pressure, and power by the density factor.
CHP is the horsepower stated by fan manufacturers in published literature and selection programs. In most cases, because it represents only the power required to drive a fan shaft at standard air-stream-density conditions of 0.075 lb per cubic foot, it either understates or overstates actual operating horsepower, depending on the effects of drive-system losses and any change in inlet-air-stream density.
Operating horsepower. Operating horsepower (OHP) is the horsepower consumed by a fan and its driver at actual operating conditions. It includes the energy required by the fan shaft (CHP), the energy required by the driver, and the effects of any change in inlet-air-stream density from standard conditions.
OHP = (CHP × density factor) + drive loss
Example 4: Fan power. If a fan were selected for 30,000 cfm, 15-in.-wg fan static pressure (FSP), 1,910 rpm, and 86 CHP based on a manufacturer’s catalog rating at standard conditions, but installed at the actual conditions in examples 1 and 2 in Part 1 of this article, expected fan performance could be calculated at these actual operating conditions:
- Density factor: Fρ = 0.83 × 0.96 × 0.98 × 0.90 = 0.70
- Calculated air-stream density: 0.0525 lb per cubic foot
- Actual volumetric capacity: 30,000 cfm
- Actual mass-flow capacity: 1,575 lb per minute
- Actual FSP: 15 in. wg × 0.70 = 10.5 in. wg
- Actual fan-shaft power: 86 CHP × 0.70 = 60.2 hp
- V-belt drive loss from Air Movement and Control Association (AMCA) International: 4 percent of actual motor output power
- OHP = (CHP × density factor) + drive loss = (86 CHP × 0.70) + (0.04 × 60.2) = 60.2 hp + 2.4 hp = 62.6
If the fan were operated during startup, purge, or shutdown without heat or moisture, fan operating performance would be:
- Density factor: Fρ = 1temp × 0.96pressure × 1moisture × 0.90elevation = 0.864
- Calculated air-stream density = 0.0648 lb per cubic foot
- Actual volumetric capacity: 30,000 cfm
- Actual mass-flow capacity: 1,944 lb per minute
- Actual FSP: 15 in. wg × 0.864 = 13.0 in. wg
- Actual fan-shaft power: 86 CHP × 0.864 = 74.3 hp
- V-belt drive loss from AMCA International: 4 percent of motor output power
- OHP = (CHP × density factor) + drive loss = (86 CHP × 0.864) + (0.04 × 74.3) = 74.3 hp + 3 hp = 77.3
Based on a calculated OHP of 62.6, one might decide to select a 75-hp motor. But note that with a drive loss of 4 percent, the primary difference between the CHP (86) and OHP (62.6 or 77.3) is caused by the change in air-stream density. And because air-stream density may vary, particularly during startup, system purge, or shutdown, either control via a fan damper or a variable-frequency-drive (VFD) controller is recommended, or the next-size-larger motor should be selected.
In summary, OHP allows for changes in air-stream composition and the energy losses required to drive a fan. Both OHP and CHP should be considered in motor selection.
In some cases, final motor selection is based not on the above criteria, but on the minimum motor horsepower required to start a fan and bring it up to full speed. This is the effect of the combined wheel, shaft, and driver inertia required of a motor to put a fan in rotation from a resting position.
Air horsepower. Air horsepower (AHP) is the energy added to an air stream per unit time and is considered to be the actual horsepower output of a fan.
AHP = (flow rate × total pressure) ÷ 6,362
Using 30,000 actual cfm and 16-in.-wg actual fan total pressure (FTP):
AHP = (30,000 × 16) ÷ 6,362 = 75.5 hp added to the air stream
Often, it is helpful to calculate the AHP output of a fan to better understand the construction requirements of the fan system and the energy available within the system.
Key points. CHP:
- Is the energy required to drive a fan shaft as stated in the manufacturer’s published charts and data.
- Is based on standard air-stream density (0.075 lb per cubic foot).
- Does not include the energy consumed by a fan drive system (V-belt, motor, or VFD losses).
OHP is the actual horsepower consumed in operation and includes both the energy consumed by a fan and the effects of changes in air-stream density (including drive losses, but not motor and VFD losses).
AHP is the useful energy added to an air stream by a fan.
Proper understanding and calculation of CHP, OHP, and AHP are necessary to fully understand the energy requirements, consumption, and delivery of a fan system.
Efficiency
Fan efficiency is the ratio of horsepower output (AHP) to horsepower input (CHP). It can be evaluated on the basis of FTP or FSP.
Total efficiency is based on FTP, and static efficiency is based on FSP, both as defined by AMCA International. Total efficiency equals AHP divided by CHP, with AHP calculated using FTP. AHP is the same in both cases. Static efficiency is the efficiency that produces the AHP, but is calculated as:
cfm × FSP ÷ 6,352
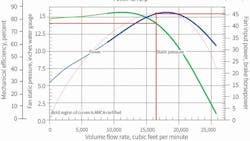
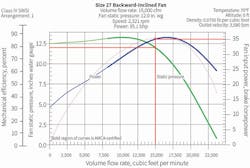
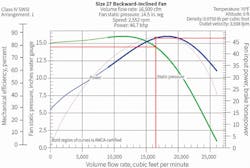
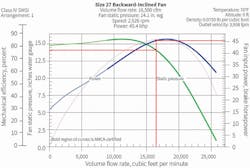
Figures 5 and 6 represent a typical selection for a backward-inclined wheel at 30,000 cfm and 10-in.-wg FSP, with the selection in Figure 5 based on peak total efficiency, and the selection in Figure 6 based on peak static efficiency.
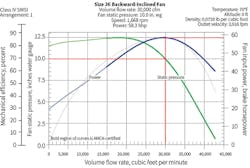
It can be seen that when a fan is selected based on peak total efficiency—which takes into consideration the efficiency of both static pressure and velocity pressure—sometimes the fan both is smaller in size and operates farther to the right on the fan curve than when the fan selection is based on static efficiency (static pressure only). However, this applies to only housed fans, as unhoused fans typically do not have a means for measuring fan inlet and outlet velocity and, thus, normally are selected based on static efficiency.
Figure 5 shows that, at 30,000 cfm, FSP is 10.0 in. wg and fan velocity pressure (FVP) is 1.0 in. wg ([3,916 ÷ 4,005]2); therefore, FTP is 11.0 in. wg. CHP of 58.3 gives a total efficiency of 0.89. Static efficiency would be 0.81 ([30,000 × 10.0] ÷ [6,352 × 58.3]).
Figure 6 shows that, at 30,000 cfm, FSP is 10.0 in. wg and FVP is 0.65 in. wg ([3,222 ÷ 4,005]2); therefore, FTP is 10.65 in. wg. CHP of 57.0 gives a total efficiency of 0.88. Static efficiency would be 0.83 ([30,000 × 10.0] ÷ [6,352 × 57.0]).
Key point: For the lowest energy consumption, determine the fan requirement in terms of FTP, and maximize the total efficiency. Maximizing fan static efficiency does not necessarily minimize energy consumption.
Fan and System Curves
Fan performance can be predicted using what commonly are referred to as the fan or affinity laws:
- Fan capacity varies directly with fan speed.
- Fan pressure varies with the square of the change in fan speed.
- Fan power varies with the cube of the change in fan speed.
The fan laws are applicable on the basis airflow through a fan is fully turbulent. Thus, in the absence of a connected system, the fan laws always are applicable. And while it is not uncommon to apply the fan laws to fan systems to predict performance, one must be careful to ensure the system to which a fan is connected also is in turbulent flow. If this condition is not met, the fan laws should be applied with care, as they cannot be applied directly to system components, such as deep high-efficiency filters, which may be operating in or near laminar flow. In these cases, a system should be separated into turbulent- and laminar-flow components for separate calculations, which later are joined for a predictable system performance curve.
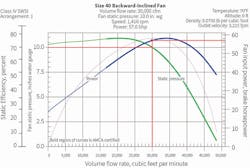
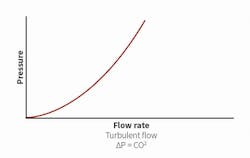
The system curve in Figure 7 represents turbulent-flow conditions in which system pressure varies with the square of system flow.
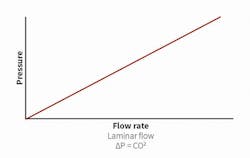
The system curve in Figure 8 represents laminar flow in which the pressure component varies directly with capacity. In this case, the fan laws cannot be applied and must be calculated separately.
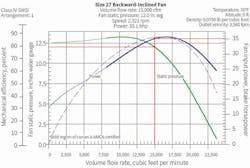
Example 5: Increase capacity by 10 percent. A fan in a system in which all components are operating in fully turbulent flow is operating at the following conditions: 2,321-rpm fan speed, 15,000-cfm fan capacity, 12-in.-wg FSP, and 35.1 CHP. What change would be required to increase the volumetric capacity by 10 percent? Assume the fan system is operating at standard air conditions.
Fan-law calculations to obtain new operating conditions:
Speed: 2,321 rpm × 1.1 = 2,553 rpm (10-percent increase)
New capacity: 15,000 cfm × 1.1 = 16,500 cfm (10-percent increase)
FSP: 12 in. wg × (1.10)2 = 14.52 in. wg (21-percent increase)
Fan horsepower: 35.1 × (1.10)3 = 46.7 hp (33-percent increase)
Fan curves for the original and revised selections are shown in figures 9 and 10, respectively.
Example 6: Increase capacity by 10 percent. A fan is operating at the conditions in Example 5; however, the FSP is assumed to be composed of 8 in. wg of components that vary based on fully turbulent flow and 4 in. wg of components that are in non-turbulent flow. Assume laminar flow. The fan speed is 2,321 rpm, the fan capacity is 15,000 cfm, the FSP is 12 in. wg, and the CHP is 35.1. What is the change required to increase the volumetric capacity by 10 percent? Assume the fan system is operating at standard air conditions.
System calculations:
Capacity: 15,000 cfm × 1.1 = 16,500 cfm (10-percent increase)
FSP: Turbulent-flow components follow the fan laws and increase by the square of the change in capacity. Laminar-flow components for this example increase directly proportional to the increase in capacity.
8 in. wg × (1.10)2 = 9.68 in. wg (21-percent increase) + 4 in. wg × 1.1 = 4.4 in. wg (10-percent increase) = 14.08 in. wg (17.3-percent increase)
New fan speed of 2,526 rpm (8.8-percent increase) and new horsepower of 45.4 (29-percent increase) have to be determined by obtaining a new fan curve at the revised flow and pressure condition.
Fan curves for the original and revised selections are shown in figures 11 and 12, respectively.
Summary
An understanding of fan total and static efficiencies aids identification and selection of the best fan for an application, while thorough consideration of all fan and system parameters aids energy-efficient design.
Correctly understanding and calculating FSP prevents unintended overdesign and system horsepower consumption.
A fan motor always should be selected based on OHP.
When changes to an existing system need to be made, proper calculation of the new system requirements based on the characteristics of each type of system component (e.g., ductwork, air-pollution-control equipment, after-filter) results in optimal design and prevents unintended overdesign.
Khalil Kairouz, PhD, PE, is an associate vice president for Carollo Engineers Inc., a consulting firm specializing in water and wastewater treatment. He has bachelor’s and master’s degrees in mechanical engineering from the University of Louisiana at Lafayette and a doctorate from Claremont Graduate University. He has taught in the mechanical-engineering departments of Loyola Marymount University and California State University. Dale Price is president of M&P Air Components Inc., a company specializing in ventilation and air-distribution equipment. He has a bachelor’s degree is mechanical engineering and is an active member of an American Industrial Hygiene Association task force on fan efficiency. He has taught numerous training sessions on fan systems and their effects to employees of state and federal agencies and private industries.
Did you find this article useful? Send comments and suggestions to Executive Editor Scott Arnold at [email protected].