Variable-frequency drives (VFDs) are electronic devices used to control electrical-motor speed and torque by varying motor input frequency and voltage. Because they can be installed in some rather harsh environments, VFDs typically are housed in enclosures designed to protect them from dust, dirt, water, and the like.
During VFD operation, heat is generated inside of the enclosures. Enclosure cooling-air requirements must satisfy both of the major components of a VFD: essentially, a computer and a power supply. For computers, optimal operating conditions generally range from a dry-bulb air temperature of 68°F to 75°F and a relative humidity of 45 percent to 55 percent. For VFD power-supply systems, optimal cooling-air temperature and humidity are higher.
Getting Rid of the Heat
Requirements for air used to remove heat dissipated into VFD enclosures vary by manufacturer. In most cases, the suggested maximum cooling-air dry-bulb temperature is very high, ranging from 104°F to 122°F, which coincides with a maximum non-condensing relative humidity of 5 percent to 95 percent and/or a maximum non-corrosive-gas relative humidity of up to 60 percent. Because of that, the additional electrical-energy expenditure associated with the conditioning of VFD-enclosure cooling air typically is overlooked, if not ignored.
When the additional electrical-energy expenditure is considered, the increase in power demand can be quite noticeable, causing a reduction in VFD energy efficiency at design load of as much as 5 percentage points for 100-hp VFD controllers.1 In California, because of reliability concerns, enclosures for VFDs serving irrigation systems have either a self-contained air-conditioning system or a common air conditioner that provides cooling for the entire motor-control center.
In many applications, VFDs are located in air-conditioned areas, and electrical energy from energy-intensive direct-expansion or chilled-water cooling systems is used to condition enclosure cooling air during mechanical cooling season. Moreover, in some instances, required electrical-energy usage is even higher when, in addition to recirculation air, ventilation air coming from outside has to be cooled. Therefore, electrical-energy usage associated with the conditioning and circulation of cooling air must be considered in evaluations of potential energy savings from application of VFDs.
If non-treated outside air is utilized (mechanical free cooling by so-called once-through ventilation systems) for VFD-enclosure cooling during summer, the cooling air could carry moisture detrimental to a VFD computer.2 Additionally, some of the cooling air might come from adjacent air-conditioned areas, increasing overall electrical-energy usage and decreasing VFD operational efficiency.
While high-dry-bulb-temperature cooling air might only slightly affect the performance of a VFD power-supply system, it could significantly shorten the life of a VFD. According to some VFD manufacturers, an 18°F increase in cooling-air dry-bulb temperature over the ambient temperature of 75°F could reduce VFD anticipated life from 20 years to 10 years. Application of the abovementioned cooling-air temperature of 104°F, then, could reduce VFD life expectancy from 20 years at the optimal environmental conditions to about six years, or by the factor of 3.4.
For optimal operational conditions, a VFD enclosure should be maintained at about 75°F and 50-percent RH, which is in line with general air-conditioning requirements. This means the average VFD-enclosure operational air temperature—the average of the cooling air entering and exiting the enclosure—should be 75°F. The overall efficiency of VFD operation is defined by two interrelated factors. The first—VFD electrical efficiency—usually is provided by a manufacturer at design conditions and is associated with the operational efficiencies of various VFD elements, such as inverter, rectifier, and cooling fan.3 The second—VFD-enclosure cooling-system efficiency—is related to supporting auxiliary cooling equipment.
Cooling is required for all VFDs, enclosed or not. However, cooling is more critical for VFDs with enclosure because of the impact of VFD-enclosure confinement. VFD-enclosure cooling is necessary at all times of operation because VFD electrical efficiency at any given load is less than 100 percent. Determining the amount of cooling necessary for a VFD enclosure requires a better understanding of VFD-controller electrical-power loss at various loads.
VFD Efficiency and Accuracy of VFD-Computer Power Metering
Verifying actual VFD efficiency based on metering by VFD computer, which, in most instances, is the only electrical-power-monitoring device available, is difficult. A VFD computer calculates (based on actual current and voltage without direct metering of power factor and power demand) output power to a motor without consideration of input power to the VFD. This approach ignores VFD power demand and energy-usage losses.
As a result, the inaccuracy of VFD-computer monitoring of output power to a motor is a relatively high ±5 percent. VFD efficiency is further reduced at loads lower than design conditions primarily because of the reduction in electrical-motor efficiency. Installing a separate commercial power meter across the line in front of the VFD controller will narrow the accuracy of power-demand monitoring to about ±1.5 percent for loads within 10 percent to 100 percent of the design load.
Even after that, reconciling with sufficient accuracy power loss through the VFD (the difference in readings between the additional power meter and VFD computer-system power meter) will be quite a challenge because of the inaccuracy noted earlier. All of these factors, along with other issues, such as variable friction and static-pressure losses in various systems,4 present a challenge, making actual VFD efficiency and energy savings difficult to verify.
Direct monitoring of the temperature and relative humidity of cooling air entering and exiting a VFD enclosure assumes the flow of air is relatively constant within the given range of cooling-air operating temperatures. The accuracy of the monitoring of VFD-enclosure cooling-air temperature and humidity with simple sensors is estimated to be in the range of ±4.0 percent. If more sophisticated instrumentation is employed, the accuracy of readings could be improved to ±3.0 percent.
Thus, under this scenario, the combined accuracy of system power-demand monitoring will be approximately ±8 percent. The accuracy could be further improved with the installation of an additional power meter in front of the VFD. In this case, the combined accuracy of the additional power meter and VFD-enclosure cooling-load monitoring system will be near ±4.5 percent. The additional power meter also could be utilized to establish the switchover point from VFD to VFD-bypass mode and vice versa to optimize and conserve system VFD power demand and electrical-energy usage for individual consumers, as well as electrical utilities.5
VFD-Enclosure Cooling-Load-Parameter Monitoring
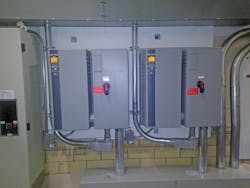
Three sensors—a combination dry-bulb-temperature and relative-humidity sensor located 3 in. below air fins in the path of cooling air entering the two enclosures, a combination dry-bulb-temperature and relative-humidity sensor located 3 in. above air fins in the path of cooling air exiting Enclosure 1, and a dry-bulb-temperature sensor located 3 in. above air fins in the path of cooling air exiting Enclosure 2—were installed to monitor VFD-enclosure cooling load (Photo A).
VFD-enclosure cooling was provided by a once-through ventilation system via a thermostat-controlled mechanical-room rooftop exhaust fan. Cooling air was supplied to the mechanical room from the corridor via wall grills. The corridor was separated from an adjacent air-conditioned manufacturing area and the outside entrance by overhead doors. Evaluation of airflow into the mechanical room shows the ratio of non-treated outside air to conditioned cooling air supplied for VFD-enclosure cooling was nearly 3-to-1.
VFD Enclosure 1 and 2 sensible-cooling load (QSENS) was calculated as:
QSENS = 1.085 × CAFR × (TEXT − TENT), Btuh (1)
where:
CAFR = cooling airflow rate, assumed to be a constant 604 cfm, per VFD-manufacturer data
TEXT = monitored temperature of cooling air exiting VFD-enclosure fins, degrees Fahrenheit
TENT = monitored temperature of cooling air entering VFD-enclosure fins, degrees Fahrenheit
VFD Enclosure 1 total cooling load (QTOT) was calculated as:
QTOT = 4.5 × CAFR × (IEXT − IENT), Btuh (2)
where:
IEXT = enthalpy of cooling air exiting VFD enclosure, based on monitored air temperature and relative-humidity parameters, British thermal units per pound
IENT = enthalpy of cooling air entering VFD enclosure, based on monitored air temperature and relative-humidity parameters, British thermal units per pound
VFD-controller power-loss factor was calculated from the following equation:
VFDPLF = QTOT ÷ 3,415 (for Enclosure 1), kilowatts (3)
VFDPLF = QSENS ÷ 3,415 (for Enclosure 2), kilowatts (4)
where:
VFDPLF = VFD-controller power-loss factor, kilowatts
The moisture carried by the cooling air as it entered the enclosures was assumed to consist primarily of water.
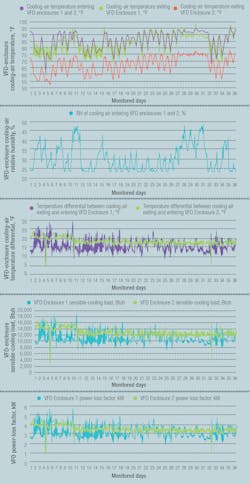
The readings in Figure 1 were taken every 30 min. The top graph shows entering cooling-air temperature (the same cooling-air temperature was applied for both enclosures), which varied from 53°F to 79°F. The top graph also shows exiting cooling-air temperature, which varied from around 61°F to 98°F. The second graph from the top indicates magnitudes of entering VFD-enclosure cooling-air relative humidity, which varied from about 23 percent to 48 percent. The third graph shows cooling-air temperature differential varies substantially.
For Enclosure 1, the temperature differential changed from approximately 9.6°F to 29.2°F, while for Enclosure 2, it varied from approximately 4.8°F to 23.8°F. The fourth graph from the top in Figure 1 shows VFD-enclosure sensible-cooling loads.
The sensible-cooling load for Enclosure 2 varied from 3,600 Btuh to 15,900 Btuh, while the sensible load for Enclosure 1 varied from 6,300 Btuh to 19,150 Btuh. Generally, Enclosure 2 sensible load was quite stable at close to 12,000 Btuh, with only occasional downward spikes. On the other hand, Enclosure 1 sensible load was constantly changing. The overall average sensible-cooling loads for the considered period for Enclosure 1 and Enclosure 2 were 10,580 Btuh and 11,950 Btuh, respectively.
Thus, the average sensible-cooling load for Enclosure 2 is higher than the average cooling load for Enclosure 1 by about 13 percent. The bottom graph in Figure 1 depicts power-loss factor (PLF) for the two VFD controllers, which was found by converting the heat dissipated into each of the VFD enclosures to correlated kilowatt magnitudes. The maximum and minimum values of PLF for Enclosure 1 were 5.6 kW and 1.1 kW, respectively, averaging 3.1 kW. The maximum and minimum PLF values for Enclosure 2 were 4.6 kW and 0.9 kW, respectively, averaging 3.5 kW.
Next month, Part 2 of this article will look at VFD-enclosure overall cooling-air load, including the impact of combined sensible- and latent-cooling-load components on VFD power-demand loss factor.
References
- Burt, C.M., Piao, X., Gaudi, F., Busch, B., & Taufik, N.F.N. (2006). Electric motor efficiency under variable frequencies and loads. Available at http://bit.ly/Burt_VFD
- Polka, D. (2001). How to maintain a VFD. New Berlin, WI: ABB.
- Peltola, M. (2000). Efficiency of AC drive systems. Helsinki, Finland: ABB.
- Burd, A.L., & Burd, G.S. (2014, August). Evaluating power-demand reduction with VFD-controlled systems. HPAC Engineering, pp. 22-29. Available at http://bit.ly/Burd_0814
- Burd, A.L., & Burd, G.S. Optimized power demand control system for electrical motors. United States Patent No: US 8,143,819 B2. 8 claims. Date of patent March 27, 2012.
############
Alexander L. Burd, PhD, PE, is president of, and Galina S. Burd, MS, is a project manager for, Advanced Research Technology, an engineering and research consulting firm with offices in Suffield, CT, and Green Bay, WI. Alexander ([email protected]) has 35 years of experience in the design, research, and optimization of HVAC and district energy systems, which includes the publication of more than 35 research and technical papers in American and European journals, while Galina ([email protected]) has more than 25 years of design and research experience in the HVAC and architectural-engineering field and has co-authored many technical and research papers in American journals. Alexander and Galina have co-authored three U.S. patents related to energy conservation.


