One of the simple truths of building operation is you need to measure what you want to manage. Of primary concern to most building operators is energy use. Employee costs, however, easily are 100 times energy costs (i.e., $200 to $300 per square foot vs. $2 to $3 per square foot). With a mere 1-percent increase in worker productivity equaling all that is being spent on energy, it behooves building operators to better manage—and measure—two aspects of building operations that directly impact worker health and productivity: ventilation and moisture.
Ventilation
While overventilation wastes energy, underventilation reduces worker productivity (see “The Case for Increased Ventilation” by David Harlos, ScD, and Michael West, PhD, PE, HPAC Engineering, March 2010). In locations such as conference rooms, one cause of underventilation is the use of thermostats to control variable-air-volume (VAV) operation. To prevent stagnation of air, VAV boxes usually are set up to provide a minimum amount of supply air even in the absence of a call for additional cooling. During unoccupied periods, then, the air supplied by a VAV box at its minimum setting has the potential to overcool a space; because of this cooling effect, after occupancy, there is a delay before the thermostat senses a rise in temperature sufficient to instruct the VAV box to open to provide even the ASHRAE-recommended minimum airflow. This is of particular concern because of the growing threat of mutating contagious airborne viruses, such as human influenza, the swine flu, and avian flu.
One way to improve ventilation effectiveness and lessen the possibility of virus sharing among occupants is to change to a displacement airflow geometry (supply air in low and exhaust air out high). While the more widely utilized well-mixed geometry (supply and exhaust locations in the ceiling) yields uniform temperature distribution, it almost guarantees exposure to viruses shed by occupants.
Ventilation performance can be assessed through accurate measurement of carbon-dioxide (CO2) concentration in an occupied space, as people generate CO2 as a function of metabolic rate in a predictable fashion. For instance, with a metabolic rate of 1.2, an adult doing light work typically generates CO2 at a rate of 0.0106 cfm. So it is consistent with CO2 measurements in parts per million, this generation rate is multiplied by a million to become 10,600. To determine ventilation rate (cubic feet per minute per person), divide this per-person CO2-generation rate by the difference between indoor and outdoor CO2 levels.
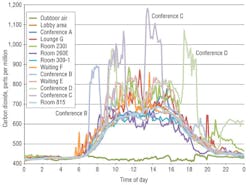
Figure 1 shows an underventilation condition in a medical center. At 1:24 p.m., the CO2 level is 1,180 ppm in Conference Room C and 430 ppm outdoors. Dividing the CO2-generation rate of a person doing light work (10,600) by the difference between indoor and outdoor CO2 levels (750), we see the ventilation rate in Conference Room C could be no greater than 14 cfm per person, which is 30 percent less than the ASHRAE-suggested minimum of 20 cfm per person. (It is worth noting the ASHRAE-recommended minimum has been shown to not be particularly effective in preventing the spread of airborne viruses, and higher ventilation rates can reduce short-term absenteeism rates.1)
The data in Figure 1 were generated with a shared-sensor monitoring system. A vacuum pump and solenoid arrangement automatically delivered air samples sequentially to a centrally located high-quality sensor. The accuracy and reliability of the more typical approach of employing multiple CO2 sensors, with their minimum ±30-ppm margin of error, has been found lacking, with one independent study2 reporting, “None of the transmitter models meet(s) (its) manufacturer-specified accuracy statement for all three transmitters of a given model over the full range of test conditions.” Not only was the accuracy claimed by the manufacturer not being achieved, it was insufficient to provide actionable data in the first place.
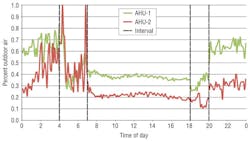
Another important piece of diagnostic feedback is percentage of outdoor air (OA) in supply air (SA), which is calculated by dividing the difference between return-air (RA) and SA CO2 values by the difference between RA and OA CO2 values. For an example, see Figure 2. At midday, Air-Handling Unit 1 (AHU-1) yields a percentage of OA in SA of 39.2 (114 ppm [725 ppm of CO2 in RA minus 611 ppm of CO2 in SA] divided by 291 ppm [725 ppm of CO2 in RA minus 434 ppm of CO2 in OA]). At the same time, AHU-2 yields a percentage of OA in SA of 20.8 (60 ppm [723 ppm of CO2 in RA minus 663 ppm of CO2 in SA] divided by 289 ppm [723 ppm of CO2 in RA minus 434 ppm of CO2 in OA]).
As can be seen in Figure 2, the percentage of OA in SA increases during unoccupied periods. For example, at 10 p.m., AHU-1 yields a percentage of OA in SA of 63.2 (12 ppm [467 ppm of CO2 in RA minus 455 ppm of CO2 in SA] divided by 19 ppm [467 ppm of CO2 in RA minus 448 ppm of CO2 in OA]). At the same time, AHU-2 yields a percentage of OA in SA of 30.4 (7 ppm [471 ppm of CO2 in RA minus 464 ppm of CO2 in SA] divided by 23 ppm [471 ppm of CO2 in RA minus 448 ppm of CO2 in OA]).
While such differences between air streams at an AHU are small, they are consistent. Again, only the shared-sensor monitoring approach is capable of yielding meaningful results.
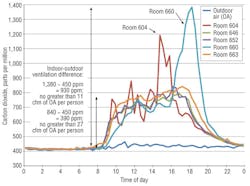
Accurate indoor and outdoor CO2 measurements also can be used to gauge the effectiveness of an overnight purge. The data in Figure 3 were collected in offices not being completely rid of human bioeffluents overnight. Conference rooms experienced the highest CO2 values.
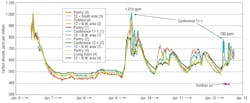
Lastly, accurate CO2 measurements are vital in assessments of the potential for demand-controlled ventilation (DCV), the automatic balancing of ventilation in spaces in which occupancy varies. Figure 4 shows CO2 measurements taken on the sixth floor of a 10-story building. The reading of 1,383 ppm, in contrast to the OA value of 435 ppm, at 6:13 p.m. corresponds to a ventilation rate no greater than 11.2 cfm per person. Until such local distribution problems are addressed, this floor is a poor candidate for DCV.
Moisture Management
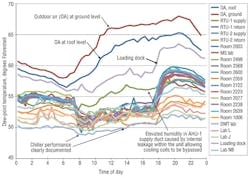
Trending and plotting dew-point temperature, a measure of the absolute humidity of air, reveals the dehumidification or humidification performance of a HVAC system. Also, it can serve as an early warning system, identifying locations of elevated moisture, a precursor to mold growth.
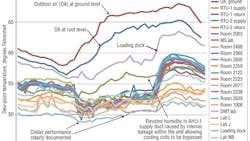
Figure 5 shows what can be learned from accurate monitoring of dew-point temperature. Perhaps most significantly in this case, monitoring revealed elevated humidity in the AHU-1 supply duct. An investigation showed a piece of sheet metal in the AHU had torn loose and was allowing the dehumidifying cooling coil to be bypassed. Monitoring also revealed significant infiltration of unconditioned outdoor air impacting the loading dock. Building leakiness also could be inferred by comparing the moisture management in some of the laboratories, especially the DMT lab, with that in the rest of the building. It is interesting to note that this data, generated with a shared-sensor monitoring system, revealed a difference in OA humidity between the ground level and roof level of the building.
Conclusion
If buildings are to become smarter and perform better, their operators need more diagnostic feedback. One critical aspect of monitoring is accuracy; otherwise, the old computer slogan of “garbage in, garbage out” applies.
References
1) Milton, D.K., Glencross, P.M., & Walters, M.D. (2000). Risk of sick leave associated with outdoor air supply rate, humidification, and occupant complaints. Indoor Air, 10, 212-221.
2) NBCIP. (2009). Product testing report: Wall mounted carbon dioxide (CO2) transmitters. Retrieved from http://www.iowaenergycenter.org/wp-content/uploads/2012/05/PTR_CO2.pdf
With an educational background in chemical engineering (bachelor’s degree from Northeastern University) and environmental health (master’s degree from Harvard School of Public Health) and more than 30 years of experience resolving indoor-air-quality issues, David W. Bearg, PE, has a deep understanding of what it takes to achieve a healthy indoor environment. He is the author of the book “Indoor Air Quality and HVAC Systems,” published in 1993.
Did you find this article useful? Send comments and suggestions to Executive Editor Scott Arnold at [email protected].
