End users of solar thermal systems expect a measurable and significant return on their investment. To provide the most accurate system-performance numbers and meet customers' expectations, it is necessary to model these systems with software that can produce reports validating system design and performance. In this article, we are going to look at the information needed for the design of a forced-circulation solar thermal system and then extract from the reports information the simulation produces.
The majority of the solar thermal systems in the United States feature a backup heat source. It could be natural gas, LP, or even electric. In a solar thermal system, the British thermal units generated from the system offset the amount of energy needed from the backup heat source. This is stated as a solar fraction. A more formal definition is the amount of energy provided by the solar technology divided by the total energy required. This takes into account the electrical energy needed for pumps, efficiencies, heat losses via transmission (pipes), and jacket losses. The solar fraction, which is offered as a percentage, usually is the guiding factor in determining how may collectors are needed.
Solar-thermal sizing software will tell us what solar fraction is achieved when we input the project location, number and size of collector, inclination (angle of mount), and orientation (east or west of true south). Another critical variable is a cumulative gallon per day (GPD). The baseline objective of solar is to produce hot water, and the GPD ultimately is the target the system is trying to reach. It also is necessary to input the British thermal unit rating of the backup heat source so that the software will determine what the solar load will offset. Another significant factor in modern sizing software is the ability of the software to pull historical weather data for the project location and incorporate that into the projected performance of the system.
This sounds fairly simple, but there are twists and turns with every piece of software. Just because a report says "90% solar fraction" doesn’t necessarily mean the system will deliver that in actual performance.
It is important to recognize a few guiding factors about solar-thermal design before we move forward. First, a designer usually will try to include at least 1 gal. of storage per square foot of collector space. Second, quite a few systems are being pressurized up to 60 psi to prevent stagnation conditions until the system fluid is above 300°F.
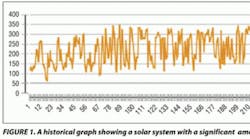
After inputting all of the values discussed earlier, the simulation data produce a graph. Yearly and historical weather data will provide a reference point to see if a system is modeled with significant amounts of stagnation potential (see Figure 1).
Collector Temperatures
In Figure 1, the bottom horizontal axis represents all 365 days of the year. The vertical axis on the left illustrates the fluid temperature in the collector. The volume of the tanks provide storage for these harvested British thermal units, so there is a minimum threshold for storage based on square feet of collector space. If you have at least 1 gal. of storage per square foot of collector space, the collector temperature will be well within acceptable range of working temperatures. If your collector is well designed, a sensor that directly measures fluid temperature in the collector will be fully immersed in the flow stream of the collector.
As previously mentioned, a forced- circulation (closed-loop) system pressurized to 60 psi will only experience stagnation above 300°F. If the graph shows consistent temperature spikes above 300°F, then we know that stagnation conditions will be present. In Figure 1, the collector temperatures show consistent temperatures above 300°F, which means this system is a prime candidate for removing collectors, adding storage, or a combination of the two.
Now that we have established how collector temperatures can be used as a tool to validate system design, let’s review a forced-circulation system and see how we can more responsibly design a project. Figure 2 illustrates a dedicated storage tank (Tank 1) for solar preheat. All incoming cold water goes to Tank 1. The solar preheated water is transferred into Tank 2 for storage until the tank falls below set point. The water heating appliance then rersponds to the call for heat as it backs up the system.
Here is a practical exercise, with this illustration in mind. Although the illustration shows only one large collector, picture 1,820 sq ft of collector space. This system also features two tanks. Tank 1 is a 318-gal. tank for solar preheat. Tank 2 is a 752-gal. primary storage tank which gives us a total of 1,070 gal. The system is backed up with an appropriately sized heat source, which was a pair of 500,000 Btuh high efficiency heaters.
We ran the simulation based on a 10,000-GPD load, and came up with an attractive 38.9 percent fraction. The allure of needing a 30 percent fraction to meet federal rebates would lead some to believe that this is all that is needed. But look at Figure 1 again. The cumulative volume of both tanks when compared with the collector square footage falls well below the threshold of 1 gal of storage per square foot of collector space — the design in which high collector temperatures made the system prone to periods of stagnation.
After reviewing the collector temperatures in the first setup, let's try to find some balance and economy by modifying the system only by adjusting the collector square footage and amount of storage. We are going to decrease the square footage of collector space and minimally increase the volumes of both Tank 1 and Tank 2. We removed 520 sq ft of collector space and added 114 gal. of storage volume to Tank 1 and 188 gal. of storage volume to Tank 2. We then re-ran the simulation. We did not change any other variable.
The second simulation then was run using the following parameters: 1,300 sq ft of collector space, 432 gal. of solar preheat, and 940 gal. of primary storage. Now our total storage volume is 1,372 gal. and is much more in line with the 1 gal. of storage per square foot of collector space.
After running this simulation, the solar fraction jumped up to a healthy 42.8 percent. More importantly, the collector temperatures shown in Figure 3 are much more in line with a responsibly designed system as there are only minimal periods of potential stagnation late in the year.
Now do some basic math for the material costs. How does the cost of 520 sq ft of collector space compare with the cost of an additional 302 gal. of storage? Pricing will vary across the country, but value and responsible design is achieved with fewer collectors and more storage. More importantly, system efficiency is significantly higher, which lends itself to a faster return on investment.
Using Report Information
We now are going to use the report from another project that featured different parameters and focus on other valuable information that can be extracted from simulation software.
The highlighted value in Table 1 shows the cubic feet of natural gas the solar thermal system offsets. This is an extremely valuable number because now we can assign some real dollar savings to this number.
We know that a cubic foot of natural gas contains 1,000 Btu by volume. We also know there are 100,000 Btu in a therm of natural gas. If we divide the highlighted number in Table 1 by 100, we will extract the number of therms saved annually; so 1,224,502 divided by 100 equals 12,245 therms saved annually. This number can be used to assign a cost per therm and calculate simple payback. If you have a boiler or water heater that is less efficient, the same square footage of collector can provide and offset a higher percentage of gas usage, with the fraction going up as well. It is easy to simulate different boiler and water-heater products to tailor a system to an end user’s budget. These numbers are not just available for natural gas, they can be reflected in gallons of LP gas or watts of electric heat.
Let's say you are designing a solar-thermal system for a client who is considering other designs as well. Rather than focusing on solar fractions, your client wants to compare each system's British thermal unit per square foot on an annual basis based on historical weather data with comparable square footage of collectors. Table 2 can be used to show performance on a per-square-foot basis, as opposed to an OG-100 certification that illustrates thousands of British thermal units per day per collector. While that is a good number for a test standard, it is not a real-world number that takes into account location, insulation (solar thermal energy available), direction, inclination, and storage. Ultimately it cannot provide a system-specific solar fraction.
Table 2 shows the annual yield from the collector field. The 1,217,434 is listed in thousands of British thermal units, so we have to multiply it by 1,000 to get the correct sum of British thermal units. At this point, you then can do some simple math to see how many British thermal units per square foot your system will harvest on an annual basis. In this example, 1,217,434,000 annually collected British thermal units divided by 365 days a year equals 3,335,435 British thermal units per day. Divide this number by the square feet of collector space to obtain your British thermal unit per square foot for an annual average per square foot. In this instance, dividing by 3,907 sq ft of collector equals 853.71 British thermal unit per square foot. This is a pretty healthy number that accounts for all of the historical weather data (including cloudy days) and really can shine a spotlight on system performance.
Summary
Do not be fooled by artificially high solar fractions if collector temperatures indicate stagnation conditions. This is where you want to focus your attention if you have a project with a very high solar fraction, but less than a gallon of storage per square foot of collector space. Achieving high solar fractions by loading up on collectors and minimizing storage volume looks good on paper, but also looking at collector temperatures, annual field yield, and fuel savings will let you know a system is responsibly designed.
You are now armed with the information necessary to discern whether or not a solar design is responsible or not. Responsible design must always be done by the numbers, and the end user always should always be informed as to what an actual collector-temperature graph represents. If you are looking to purchase solar design software, make sure it includes the ability to print detailed reports that includes the annual British thermal unit yield of the collector field and cubic feet of natural gas or energy being offset by the system. All of those factors, coupled with proper instructions for the end user, will result in a better understanding of the value and benefits of solar thermal systems.
Did you find this article useful? Send comments and suggestions to Senior Editor Ron Rajecki at [email protected].
Paul Rohrs is a solar- and residential-boiler product manager for Lochinvar Corp. He has been in the plumbing, heating, and hydronics industry for more than 22 years. Previously, he was a licensed contractor with radiant design and installation experience.


