With growing concern about fossil-fuel consumption and carbon-dioxide emissions has come increased interest in add-on boiler controllers. This article demonstrates how a commonly used method of testing these devices often overpredicts energy savings and proposes an alternative method that avoids the error.
The Controllers
Available from multiple vendors, the controllers block boiler calls for heat during times of low demand. The reduction in number of boiler cycles eliminates purge losses that occur during burner startup, but also broadens the operating-temperature band of a boiler and reduces the average water temperature in the heating system.
The Test Method Once installed, add-on boiler controllers commonly are tested by operating systems with the controllers on and off on alternating days and measuring fuel usage. Fuel usage on days with the controllers active (“active days”) is compared with fuel usage on days with the controllers inactive (“inactive days”), with the difference reported as savings. In this article, this is referred to as the alternating-day test method.
For the alternating-day test method to be valid, over each full day of testing, the heat added to the system must equal the heat removed, with no change in the thermal energy stored in the system. Any change in thermal storage between active and inactive days must be accounted for for system performance to be quantified accurately. A change in system temperature is a clear indication of a change in thermal storage.
Analysis
System-performance data with a boiler in active mode one day and inactive mode the next were collected for 48 days. Six additional days of data were collected with the boiler operating continuously in the inactive, or baseline, mode. Parameters recorded included fuel flow, boiler supply and return temperatures, and water flow through the heating loop. Fuel-flow data were collected at 1-min intervals and temperature data were collected at 2-min intervals for a total of more than 100,000 data points.
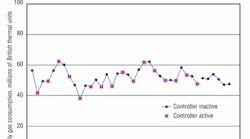
Gas-meter data were used to calculate daily fuel usage. Results for the final five weeks of testing are shown in Figure 1. Figure 1 shows considerable daily variation in fuel usage, much of which is attributed to changes in weather or usage patterns. Note, for example, the 14-percent spread over the final six days of data collection, when the boiler was running in inactive mode every day. At a job site, this level of variation probably is unavoidable. An important benefit of the alternating-day test method is that random variations in weather or usage even out over time.
Over the course of the 48 days of alternating operation, average fuel usage was 4.4-percent less on active days than it was on inactive days. Figure 2 shows boiler supply, return, and average temperatures for four consecutive days. The difference in appearance between the inactive (first and third) days and the active (second and fourth) days is significant. According to the data:
- The boiler cycled less frequently on the active days.
- The gulf between maximum and minimum water temperatures was greater on the active days.
- Average system temperature changed noticeably with each mode transition. Average temperature was lower on the active days than it was on the inactive days.
Data were recorded at 2-min intervals for 24 days of active operation and 24 days of inactive operation and averaged to obtain a composite active day and a composite inactive day (Figure 3). Not surprisingly, the composite days have appearances similar to those of the temperature traces in Figure 2, albeit with much less scatter in the data.
To make the difference between active and inactive days clearer, the composite days are plotted on a single 24-hr time axis in Figure 4. (For the remainder of this article, differences between active-day and inactive-day data will be presented in this fashion.)
The shapes of the temperature curves in Figure 4 are significantly different. The biggest change in temperature occurs immediately after the mode transition, at midnight. Although the temperatures are different between the two modes, there is little change in temperature within each mode from 11 a.m. until midnight. The change in system temperature that happens with every change in operating mode indicates a change in energy storage is occurring.
The heat removed from water in the heating loop for delivery to the load was calculated using the temperature drop across the heating loop for all active and inactive days. Composite supply and return temperatures as a function of time of day were calculated using the same procedure used to calculate the average temperatures in Figure 4. The four data traces (two supply and two return temperatures) are shown in Figure 5.
Using the composite supply and return temperatures, temperature drop across the load was calculated (Figure 6). Water-flow rate was constant, so the temperature drop across the heating loop was proportional to the heat delivered. Figure 6 shows the heat delivered to the load in the active and inactive modes was approximately the same 23 hr a day, from shortly after 1 a.m. until midnight. From midnight to 1 a.m.—the first hour after the mode change—on inactive days, significantly more heat was delivered by the boiler to the load.
Page 2 of 2
More heat was required during the first hour following a transition to inactive mode because the return to a higher average water temperature required the addition of heat. Figure 4 shows the temperature of water in the system changed with the change in operating mode. In addition to the water in the heating loop, the thermal mass in contact with the water (pipes, insulation, heat exchangers, walls in contact with pipes and insulation, etc.) was undergoing changes in temperature and stored energy. Upon the transition to active mode, the return to a lower system temperature allowed heat to be removed from the thermal mass of the system, so less fuel was required to deliver the necessary heat to the load.
The “Inactive − active” data trace in Figure 6 supports the observation that what happens the first hour following a mode change is not “normal operation.” At the test site, there was no reason for a dramatic change in heat demand in the hours around midnight. Building demand between 11 p.m. and midnight should have been similar to building demand between midnight and 1 a.m., while building demand between midnight and 1 a.m. should have been similar to building demand between 1 and 2 a.m. If the active and inactive results between midnight and 1 a.m. were averaged, Figure 6 would show a slow and consistent downward trend in demand between 10 p.m. and 5 a.m. Instead, Figure 6 shows a significant difference in demand that occurs at midnight and depends on whether the boiler controller is active or inactive. This is not a real change in demand; it is an artifact of the test method.
To show how the difference in heat delivered to a load affects fuel use, all active-day and inactive-day gas-usage data were averaged in 2-min increments. The 24-hr plot of composite active-day and inactive-day gas usage shown in Figure 7 looks almost identical to the 24-hr plot of composite active-day and inactive-day temperature drop across heating load in Figure 6. As in Figure 6, the biggest difference is seen between midnight and 1 a.m., which is attributed to the change in energy storage occurring with each mode transition.
For each 1-hr period, fuel usage and the heat delivered to the building were totaled. The hourly totals for all active days were summed and then averaged by dividing by the number of days. The same calculation was done for all inactive days. The differences in hourly fuel usage and heat delivered were calculated by subtracting the active results from the inactive results.
Figure 8 shows the difference in fuel usage occurring the first hour following a mode transition represents 34 percent of the total difference in fuel usage for a full day of operation. This difference was caused by the change in system temperature occurring immediately after a mode transition shown in previous plots, an artifact of the test method.
What the Analysis Tells Us
The analysis shows that nearly all of the fuel “savings” measured after transitions from inactive to active controller mode are not savings, but an artificial product or effect resulting from a change in the amount of energy stored in the system. Although the size of thermal-storage terms differs by job site, in all cases in which a boiler controller blocks calls for heat and does not change the operating setpoint, the alternating-day test method will overpredict fuel savings.
While much of the analysis focused on the difference in performance the first hour following a mode transition, changes in thermal storage may take longer to capture, depending on the portion of total fuel use thermal storage represents.
The results presented in this article required the recording of multiple channels of data at 2-min intervals for approximately seven weeks. This level of data acquisition and the subsequent analysis provided the information needed to separate energy storage from energy savings. While this approach could be duplicated, it, unfortunately, is beyond the scope of most end users. A method requiring minimal data logging, avoiding the thermal-storage error inherent in the alternating-day test method, and providing an accurate prediction of energy savings is needed.
A Better way to Measure Energy Savings
The following approach avoids the error introduced by the alternating-day test method:
- Follow a two-days-on-two-days-off, rather than a one-day-on-one-day-off, cycle of boiler-controller operation. Repeat this for the entire test period.
- Record fuel usage for every 24-hr period of operation. For example, if a mode transition is scheduled to occur every two days at 2 p.m., record fuel usage for every 2-p.m.-to-2-p.m. period for the duration of the test.
- Record fuel usage the first day following a mode transition (Day 1, Day 3, Day 5, Day 7, etc.), when data will be affected by the accompanying change in thermal storage and fuel savings will be overpredicted, for post-test-analysis comparison.
- Record fuel usage the second day following a mode transition (Day 2, Day 4, Day 6, Day 8, etc.), when the mode-transition effect on fuel use will be reduced significantly or eliminated, for a more accurate estimate of future energy savings.
- Record data for as many days as feasible, as the greater the number of days, the greater the accuracy of predicted savings. At a minimum, one should have eight weeks of total run time, which provides four weeks (the second days following mode transitions) of “usable data.”
- If results seem unsatisfactory or inconclusive, continue testing using the same method.
Summary
Prior to the purchase of an add-on boiler controller to reduce fuel use, end users should be motivated to predict as accurately as possible their future savings. As shown in this article, the choice of test method is important. One has a better chance of selecting a proper test method by possessing a basic understanding of how the controller works. Controllers that change the temperature of water directly by modifying the setpoint or indirectly by blocking calls for heat change the amount of energy stored in a system. Failure to account for changes in energy storage leads to an error in predicted energy savings. A simple test method that avoids this error and provides a more accurate estimate of energy savings was proposed.
Acknowledgement
The author wishes to thank Scott H. Smith, PhD, and Jim Gotterba, PE, MBA, of ALZETA Corp. for their support in collecting and analyzing data for this article.
The president of ALZETA Corp., John D. Sullivan is a registered professional engineer in the state of California. He has more than 30 years of engineering experience in combustion, heat transfer, and related fields.
Did you find this article useful? Send comments and suggestions to Executive Editor Scott Arnold at [email protected].


