Adam Joseph Lewis Center: A Paler Shade of Green
The Adam Joseph Lewis Center (AJLC) for Environmental Studies on the campus of Oberlin College in Oberlin, Ohio, is one of the nation’s most widely publicized green buildings. Showcasing a variety of energy-efficient strategies and technologies,1 the 13,600-sq-ft building is the winner of numerous architecture awards and was named the most important green building constructed since 1980 in a poll of green-building experts and advocates.2
The AJLC was conceived to be a zero-energy building (ZEB) or net energy exporter, with a 58-kw, 4,600-sq-ft photovoltaic (PV) array mounted on the roof generating as much energy as the building consumed annually, if not more.1 During the groundbreaking in 1998, the design team projected the all-electric building would consume 64,000 kwh of energy annually. Later, when the rooftop PV array was projected to produce 69,000 kwh of energy annually, Oberlin College Director of Environmental Studies David Orr said, “We believe that, right off the bat, the building will generate more power than it will use.”1
During its first year of occupancy (2000), however, the building consumed 215,000 kwh of electric energy—more than three times the projected amount. A post-occupancy study uncovered many differences between actual building design and what the design team had described in public literature. For instance, the building was advertised to be heated and cooled by a ground-well heat-pump system, with a “small electric boiler providing supplemental warmth.” In fact, the ground-well system was designed to heat only two-thirds of the building. The remaining third, which represented 50 percent of the winter heating load, was heated with a 112-kw electric resistive boiler. Electric resistive boilers typically use three times the energy used by a well-designed ground-source-heat-pump system. Moreover, in the case of the AJLC, the heat pumps were specified improperly, leading to the installation of a second electric boiler in the ground-well supply line to heat ground water sufficiently for use by the heat pumps.3
Post-occupancy HVAC redesign and retrofits costing in excess of $250,000, combined with operational changes and a milder winter, resulted in energy consumption dropping to 125,000 kwh in 2002, the lowest it would be for the next nine years and still double the design team’s projections. The PV array, installed in November 2000, provided less than half of the building’s energy.4 Building scientists from National Renewable Energy Laboratory (NREL), in collaboration with Oberlin College Associate Professor of Environmental Studies and Biology John E. Petersen, installed an extensive energy-monitoring system internal to the AJLC, which provided data for a case study.5 After NREL’s involvement ended, internal energy monitoring was left in Petersen’s hands.
By 2004, it was clear no roof-mounted PV array could meet the building’s energy needs. The Lewis family then gave $1 million to build a second, larger PV array over a portion of the building’s parking lot, thus, abandoning any hope of meeting the building’s energy needs within the building’s footprint.
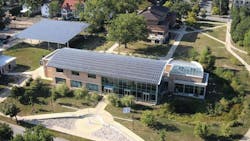
The 101-kw, 8,000-sq-ft PV parking pavilion, shown in the upper left of Photo A, brought with it new energy projections and claims. Prior to the pavilion’s May 2006 construction, the two PV arrays were projected to produce 30 percent more energy than the building consumed.6 The AJLC’s internal energy-monitoring system was expanded to include data from the new PV array. In April 2007, Petersen submitted a paper for presentation at an American Solar Energy Society meeting in Cleveland. The paper analyzed 10 months of data, concluding that the two PV arrays were on track to produce 10 percent more energy than the building consumed annually.7
Over the next four years, the AJLC’s success as a net energy exporter would be widely publicized. Oberlin College promotional literature claimed the AJLC annually produced more energy than it consumed, an assertion repeated by hundreds, if not thousands, of Websites, including those of building designer William McDonough + Partners,8 PV-array designer Solar Design Associates,9 and the U.S. Department of Energy.10 In 2011, the AJLC’s 10-year anniversary, ASHRAE published a case study11 in which a decade of data was analyzed to demonstrate that, since the 2006 installation of the PV parking pavilion, the AJLC annually had produced slightly more energy than it consumed.
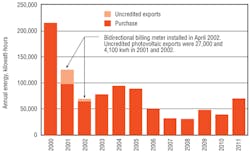
Annual utility bills, however, paint a different picture. Figure 1 shows annual electricity sales to the AJLC from 2000 through 2011. If the PV parking pavilion made the AJLC a net energy exporter, one would expect net annual electricity sales to the building to be zero after 2006. Instead, annual electricity imports averaged 43,000 kwh.
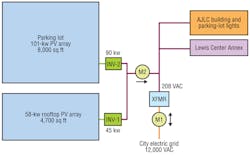
Interpretation of annual electricity bills is complicated by electrical modifications made during the fall of 2005, when a 3,700-sq-ft college-owned house adjacent to the AJLC was renovated to provide additional space for the Environmental Studies program. Figure 2 shows electric utility meters and interconnections for the AJLC complex. A bidirectional billing meter (M1) is installed on the grid side of the college-owned high-voltage transformer, while a unidirectional meter (M2) measures energy produced by both PV arrays. Electricity was fed to the renovated structure, named the Lewis Center Annex, from the AJLC’s transformer and, curiously, left unmetered. Thereafter, the utility meters measured the energy consumed by the entire AJLC complex. This left the AJLC internal monitoring system as the lone measure of AJLC energy consumption. (In February 2012, the college installed a separate billing meter on the power feed to the Lewis Center Annex.)
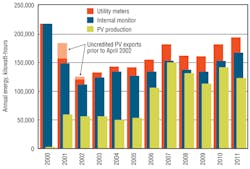
Figure 3 shows three measures of annual energy flow: energy consumption as determined by the utility meters, energy consumption as determined by the AJLC’s internal monitoring system (figures obtained from the “Historic Data” section of the AJLC’s Web-based energy dashboard [http://buildingdashboard.net/oberlin/ajlc/]), and PV production as determined by the utility meter. The graph clearly shows that from 2000 through 2011, there was not one year during which the PV arrays produced as much energy as the building consumed. Petersen has acknowledged his claims of energy sufficiency were incorrect.12
The AJLC’s internal energy-monitoring system measures nighttime isolation-transformer losses for the rooftop PV array (estimated to be 4,300 kwh per year4), but it does not measure nighttime losses for the solar parking pavilion, electric energy used by the Lewis Center Annex, and losses in the building’s high-voltage transformer (estimated to be 9,000 kwh per year3), all of which contribute to the utility-billing-meter readings. Building-transformer losses explain the differences between utility-billing-meter and internal-energy-monitoring-system readings from 2002 through 2004. From 2007 through 2011, the average annual difference between the two measures was 27,000 kwh per year. The author estimates 12,000 kwh of that was used by the Lewis Center Annex, based on meter readings taken since February 2012. That leaves 6,000 kwh of consumption measured by the utility meters that could be associated with nighttime losses in the PV parking pavilion per year.
Through Sept. 1, utility-meter data show the PV arrays had produced 31,000 kwh more electric energy than the AJLC complex had consumed in 2012. Based on previous October-through-December performance, absent a major disaster, that should be enough to carry the complex through the end of the year, making 2012 the first calendar year the PV arrays generated more electric energy than the AJLC complex consumed. (May 2012 marked the conclusion of the first 12-month period during which the PV arrays produced more electric energy than the AJLC complex consumed.)
Discussion
So, why did the addition of the solar parking pavilion not yield the desired success?
Winter heating drives AJLC energy consumption. The winter of 2002 was mild, but subsequent winters have not been so kind. Ground-source-heat-pump systems work best when heating and cooling loads are balanced; the AJLC’s are not. From the outset, the well field was undersized. Subsequent HVAC renovations have added heat load. During extended cold periods, well temperature drops below the operating range for heat pumps, activating an electric boiler in the groundwater supply line. The building, then, is heated entirely with electric resistive heat.
Another factor leading to increased energy consumption is the complexity of the AJLC’s HVAC system and controls. A handful of HVAC technicians manage 2.6 million sq ft of college buildings and do not have the resources to keep AJLC systems operating optimally. “Temporary” fixes remain in place for months, often increasing energy consumption. And, of course, as the use of technology has grown, so have plug loads in offices and classrooms. On the supply side, there have been problems with the solar parking pavilion. Several PV modules failed early, taking out the production of entire strings, and were not replaced until 2012. On numerous occasions, the inverter has tripped off for hours and even days.
Energy problems undoubtedly were reflected daily on the Web-based dashboard of the building’s internal energy-monitoring system. Identifying and solving energy problems, however, involves more than gathering and displaying data—it requires human vigilance, and that was missing. Never was there a connection between energy-monitoring efforts and the HVAC shop.
So, what caused the turnaround in 2012? First, the winter of 2011-12 was the warmest on record. Second, late in 2011, the college hired a full-time building manager tasked with identifying and solving AJLC energy problems. He arranged for the replacement of the defective PV panels and helped identify and reduce excessive energy use by the ground well pump.
This begs the question of the financial sustainability of the AJLC model. On average, the AJLC has consumed about 150,000 kwh of energy a year, energy that can be purchased for less than $20,000. Compare that with the capital cost of the two PV arrays: $1.4 million. The arrays are expected to last 20 years; the simple payback is 70 years. And consider the full-time building manager. Can any amount of energy savings justify his salary and the disproportionate amount of time devoted by HVAC technicians tasked with maintaining all of the college’s buildings? This model is neither sustainable nor scalable.
Setting aside the specifics, what are some broader lessons to be learned from the AJLC?
One lesson concerns the importance of utility meters in determining the true energy budget of a building. Sustainability requires that a ZEB generate enough energy to cover all of its energy demands, including energy lost in the grid. While grid losses are difficult to estimate, they include building-transformer losses. Utility meters measure transformer losses, while the AJLC’s internal energy-monitoring system does not. Moreover, internal meters installed by and under the control of a building’s owner typically are less accurate and reliable than utility meters and produce data that is more easily manipulated to distort building performance.
The AJLC raises questions about the scientific value of high-performance-building case studies. The 2011 case study11 gave no hint of disappointing building or PV performance. In many cases, high-performance-building case studies are little more than marketing pieces for the building owner and design team and do nothing to advance our scientific understanding of buildings.
What is the value of the zero-energy label when energy is produced outside of a building’s footprint? Surely, renewable energy is a good thing, but what is the value added by the building? When energy generation is limited to a building’s footprint, as it is with a roof-mounted PV array, there is a synergy between the building and PV array. Without such a constraint, any building, no matter how inefficient, could be a ZEB using a sufficiently large PV array—it simply is a question of land and money. A recent study shows that only a handful of commercial ZEBs and ZEB “wannabes” generate their energy within their own footprint, and of those, only two—an 8,500-sq-ft nature center in Southern California and a 5,900-sq-ft energy laboratory in Hawaii—are larger than the author’s house. If and when NREL’s widely publicized 222,000-sq-ft Research Support Facility produces more energy than it consumes, it will be with PV arrays located over nearby parking garages.13
The AJLC’s crossing of the zero-energy threshold in 2012 is to be celebrated. But unlike LEED (Leadership in Energy and Environmental Design) building certification, zero-energy status is not permanent; it is to be earned each year through performance. Success one year does not guarantee success the next. Each year brings new challenges, and constant vigilance is required.
References
1) Reis, M. (2000, March/April). The ecology of design. Environmental Design & Construction.
2) Hosey, L. (2010, July 27). The g-list. Architect. Retrieved from http://www.architectmagazine.com/green-building/web-exclusive-the-g-list-survey-of-architecture.aspx
3) Scofield, J.H. (2002). Early performance of a green academic building. ASHRAE Transactions, 108 (2), 1214-1230.
4) Scofield, J.H., & Kaufman, D. (2002, May). First year performance for the roof-mounted, 45-kw PV-array on Oberlin College’s Adam Joseph Lewis Center. Proceedings of the 29th IEEE Photovoltaic Specialists Conference, pp. 1691-1694. Available at http://www.oberlin.edu/physics/Scofield/pdf_files/pvsc-2002.pdf
5) Pless, S., & Torcellini, P. (2005). Energy performance evaluation of a low-energy academic building. Available at http://www.nrel.gov/docs/fy06osti/38962.pdf
6) Fowler, Y.G. (2005, Summer). Lewis Center boosts energy production. Oberlin Alumni Magazine. Retrieved from http://www.oberlin.edu/alummag/summer2005/ats_2.html
7) Petersen, J.E. (2007). Production and consumption of electricity in Oberlin College’s Lewis Center for Environmental Studies: Realizing the goal of a net zero building. Proceedings of the American Solar Energy Society. Available at http://oberlin.edu/faculty/petersen/ColorPrint/Petersen2007ASESProductionConsumptionAJLC.pdf
8) Adam Joseph Lewis Center for Environmental Studies, Oberlin College. (n.d.). Retrieved from http://www.mcdonoughpartners.com/projects/view/adam_joseph_lewis_center_environmental_studies_oberlin_college
9) World’s first fully solar-powered academic facility. (n.d.). Retrieved from http://www.solardesign.com/projects/project_display.php?id=16
10) Adam Joseph Lewis Center for Environmental Studies--Oberlin College (Oberlin College Lewis Center). (n.d.). Retrieved from http://zeb.buildinggreen.com/overview.cfm?projectid=18
11) Petersen, J.E. (2011, Winter). Early adopter. High Performing Buildings, pp. 20-31. Available at http://www.ideastream.org/common/images/soi/2011/early-adopter.pdf
12) Scofield, J., & Petersen, J.E. (2012). Discussion: Oberlin College’s Adam Joseph Lewis Center: Oberlin, OH. Retrieved from http://www.hpbmagazine.org/File Library/Unassigned/PetersenScofieldComments.pdf
13) New Buildings Institute. (2012). Getting to zero 2012 status update: A first look at the costs and features of zero energy commercial buildings. Retrieved from http://www.newbuildings.org/sites/default/files/GettingtoZeroReport_0.pdf
An experimental solid-state physicist with applied research interests, John H. Scofield teaches in the Department of Physics and Astronomy at Oberlin College. His current research is broadly associated with energy: energy in buildings, energy efficiency, wind and photovoltaic power, and energy policy. He has conducted detailed studies of the energy consumption of two green buildings: the Leslie Shao-ming Sun Field Station at Jasper Ridge Biological Preserve of Stanford University in Stanford, Calif., and the Adam Joseph Lewis Center for Environmental Studies at Oberlin College. In 2007-08, he helped conduct the American Physical Society’s energy-efficiency study and co-authored the final report, “How America Can Look Within to Achieve Energy Security and Reduce Global Warming” (http://bit.ly/APS_report). Recently, he studied the energy consumption of commercial buildings certified under the U.S. Green Building Council’s LEED (Leadership in Energy and Environmental Design) rating program, concluding LEED certification is yielding no significant reduction in greenhouse-gas emissions (http://bit.ly/Scofield_LEED).
Did you find this article useful? Send comments and suggestions to Executive Editor Scott Arnold at [email protected].


